Market Outlook
October 16, 2017
Market Cues
Domestic Indices
Chg (%)
(Pts)
(Close)
Indian markets are likely to open positive tracking global indices and SGX Nifty.
BSE Sensex
0.8
250
32,433
Nifty
0.7
71
10,167
The US indices moved modestly higher on Friday, offsetting the pullback seen over
the course of the previous session. With the upward move on the day, the Dow and
Mid Cap
0.0
7
15,967
the Nasdaq climbed to new record closing highs. The Dow closed up 0.1 percent to
Small Cap
0.1
22
16,926
22,872, the Nasdaq rose 0.2 percent to 6,606 and the S&P 500 inched up 0.1
Bankex
1.3
365
27,746
percent to 2,553. The modest strength on Wall Street came following the release of
some upbeat economic data, including a Commerce Department report showing a
Global Indices
Chg (%)
(Pts)
(Close)
substantial increase in retail sales in the month of September.
Dow Jones
0.1
31
22,872
The FTSE 100 index came off its lows in late afternoon trading as US stocks pushed
Nasdaq
0.2
14
6,606
up to fresh highs today following some benign US data, though London shares
FTSE
(0.3)
(21)
7,535
remained weaker weighed by a rally in the pound. The FTSE 100 index closed the
Nikkei
1.0
200
21,155
day at 7,535, down 0.3%.
Hang Seng
0.1
17
28,476
In India, the Nifty surged to a record close at 10,167 and the Sensex hit over two-
Shanghai Com
0.1
4
3,391
month high after the data indicated that industrial production expanded to a 9-
month high of 4.3% in August, while retail inflation came in at 3.28% in September,
Advances / Declines
BSE
NSE
unchanged from August. The rupee stood firm against the US dollar, which fuelled
Advances
1,307
787
the rally. BSE Sensex closed higher by 250 points to 32,433, while the Nifty 50 rose
71 points to close at 10,167.
Declines
1,466
930
Unchanged
107
82
Result Review
Consolidation in the Indian telecom sector continues
Volumes (` Cr)
Detailed analysis is on Pg2
BSE
4,246
NSE
29,752
Investor’s Ready Reckoner
Key Domestic & Global Indicator
#Net Inflows (` Cr)
Net
Mtd
Ytd
Stock Watch: Latest investment recommendations on 150+ stocks
FII
(297)
(2,852)
33,67
Refer Pg7 onwards
MFs
198
3,784
90,12
Top Picks
CMP
Target
Upside
Company
Sector
Rating
Top Gainer
Price (`)
Chg (%)
(`)
(`)
(%)
Blue Star
Capital Goods Accumulate
785
867
10.4
Sobha
465
9.3
Dewan Housing FinanceFinancials
Accumulate
538
610
13.4
Bhartiartl
432
7.9
Asian Granito
Other
Buy
487
570
17.0
Oberoirlty
447
7.6
Navkar Corporation
Other
Buy
192
265
38.2
Ktkbank
163
6.7
KEI Industries
Capital Goods
Accumulate
336
380
13.1
More Top Picks on Pg5
Canfinhome
559
6.2
Key Upcoming Events
Top Loser
Price (`)
Chg (%)
Previous
Consensus
Date
Region
Event Description
Reading
Expectations
Iifl
602
(3.8)
Oct16, 2017 India
Monthly Wholesale Prices YoY%
3.24
3.30
Ibrealest
215
(3.2)
Oct16, 2017 US
Industrial Production
(0.90)
0.30
Bomdyeing
207
(3.1)
Oct17, 2017 China
Consumer Price Index (YoY)
1.80
1.60
Ghcl
241
(2.9)
Oct17, 2017 Euro Zone Euro-Zone CPI (YoY)
1.50
1.50
Oct17, 2017 UK
CPI (YoY)
2.90
3.00
Mmtc
61
(2.7)
More Events on Pg7
#as on 13th Oct, 2017
Market Outlook
October 16, 2017
Result Review
Consolidation in the Indian telecom sector continues
Consolidation in the Indian telecom has continued with the latest merger
agreement between TTSL and TTML with Bharti Airtel. As part of this
Agreement Bharti Airtel will absorb Tata Consumer Mobile Businesses’ (CMB)
operations across the country in nineteen circles (17 under TTSL and 2 under
TTML). These circles represent bulk of India’s population and customer base.
The merger is being done on a debt-free cash-free basis. The move provides
an exit route to the bleeding Tata group telecom companies. With the
consolidation in the telecom sector, the profitability may increase as
companies will adopt cost saving strategies to fight with the hyper competition.
Economic and Political News
Rupee closes higher against US dollar for fifth session
India on a very solid track, note ban and GST monumental reforms: IMF's
Lagarde
Slowdown bottomed out, GDP may grow 7% in FY18: Niti VC Rajiv Kumar
Corporate News
TCS continues to struggle for growth
Reliance Retail to resume JioPhone booking post Diwali
D-Mart parent Avenue Supermarts Q2 profit rises 65.2% to `191cr
Volkswagen targets 3% share in Indian passenger vehicle market
Market Outlook
October 16, 2017
Quarterly Bloomberg Brokers Consensus Estimate
Colgate Palmolive - Oct 16, 2017
Particulars ( ` cr)
2QFY18E
2QFY17
y-o-y (%)
1QFY18 q-o-q (%)
Sales
1,125
1,084
3.7
1,129
(0.4)
EBIDTA
290
214
35.3
272
6.5
%
25.8
19.7
24.1
PAT
178
128
39.9
166
7.7
Market Outlook
October 16, 2017
Top Picks
Market Cap
CMP
Target
Upside
Company
Rationale
(` Cr)
(`)
(`)
(%)
Strong growth in domestic business due to its leade`hip
in acute therapeutic segment. Alkem expects to launch
Alkem Laboratories
21,891
1,831
2,079
13.6
more products in USA, which bodes for its international
business.
We expect the company would report strong profitability
Asian Granito
1,466
487
570
17.0
owing to better product mix, higher B2C sales and
amalgamation synergy.
Favorable outlook for the AC industry to augur well for
Cooling products business which is out pacing the
Blue Star
7,517
785
867
10.4
market growth. EMPPAC division's profitability to
improve once operating environment turns around.
With a focus on the low and medium income (LMI)
consumer segment, the company has increased its
Dewan Housing Finance
16,863
538
610
13.4
presence in tier-II & III cities where the growth
opportunity is immense.
Loan growth is likely to pick up after a sluggish FY17.
Lower credit cost will help in strong bottom-line growth.
Karur Vysya Bank
7,814
129
180
39.2
Increasing share of CASA will help in NIM
improvement.
High order book execution in EPC segment, rising B2C
KEI Industries
2,615
336
380
13.1
sales and higher exports to boost the revenues and
profitability
Expected to benefit from the lower capex requirement
Music Broadcast
2,255
395
434
9.8
and 15 year long radio broadcast licensing.
Massive capacity expansion along with rail advantage
Navkar Corporation
2,735
192
265
38.2
at ICD as well CFS augur well for the company
Strong brands and distribution network would boost
Siyaram Silk Mills
2,515
2,683
2,856
6.4
growth going ahead. Stock currently trades at an
inexpensive valuation.
Market leaderhip in Hindi news genre and no.
2
viewe`hip ranking in English news genre, exit from the
TV Today Network
2,161
362
435
20.1
radio business, and anticipated growth in ad spends by
corporates to benefit the stock.
After GST, the company is expected to see higher
volumes along with improving product mix. The Gujarat
Maruti Suzuki
2,37,803
7,872
8,658
10.0
plant will also enable higher operating leverage which
will be margin accretive.
We expect loan book to grow at 24.3% over next two
GIC Housing
2,746
510
655
28.4
year; change in borrowing mix will help in NIM
improvement..
Source: Company, Angel Research
Market Outlook
October 16, 2017
Key Upcoming Events
Result Calendar
Date
Company
October 16, 2017
Colgate Palmolive
October 17, 2017
Axis Bank, ACC, Bajaj Auto, Wipro
Source: Bloomberg, Angel Research
Global economic events release calendar
Bloomberg Data
Date
Time
Country
Event Description
Unit
Period
Last Reported
Estimated
Oct 16, 2017
12:00 PMIndia
Monthly Wholesale Prices YoY%
% Change
Sep
3.24
3.30
6:45 PMUS
Industrial Production
%
Sep
(0.90)
0.30
Oct 17, 2017
7:00 AMChina
Consumer Price Index (YoY)
% Change
Sep
1.80
1.60
2:30 PMEuro Zone Euro-Zone CPI (YoY)
%
Sep F
1.50
1.50
2:00 PMUK
CPI (YoY)
% Change
Sep
2.90
3.00
Oct 18, 2017
6:00 PMUS
Housing Starts
Thousands
Sep
1,180.00
1,180.00
6:00 PMUS
Building permits
Thousands
Sep
1,272.00
1,235.00
2:00 PMUK
Jobless claims change
% Change
Sep
(2.80)
Oct 19, 2017
6:00 PMUS
Initial Jobless claims
Thousands
Oct 14
243.00
247.50
7:30 AMChina
Industrial Production (YoY)
% Change
Sep
6.00
6.40
7:30 AMChina
Real GDP (YoY)
% Change
3Q
6.90
6.80
Oct 20, 2017
7:30 PMUS
Existing home sales
Million
Sep
5.35
5.30
Oct 23, 2017
7:30 PMEuro Zone Euro-Zone Consumer Confidence
Value
Oct A
(1.20)
Oct 24, 2017
1:00 PMGermany PMI Services
Value
Oct P
55.60
1:00 PMGermany PMI Manufacturing
Value
Oct P
60.60
Source: Bloomberg, Angel Research
Market Outlook
October 16, 2017
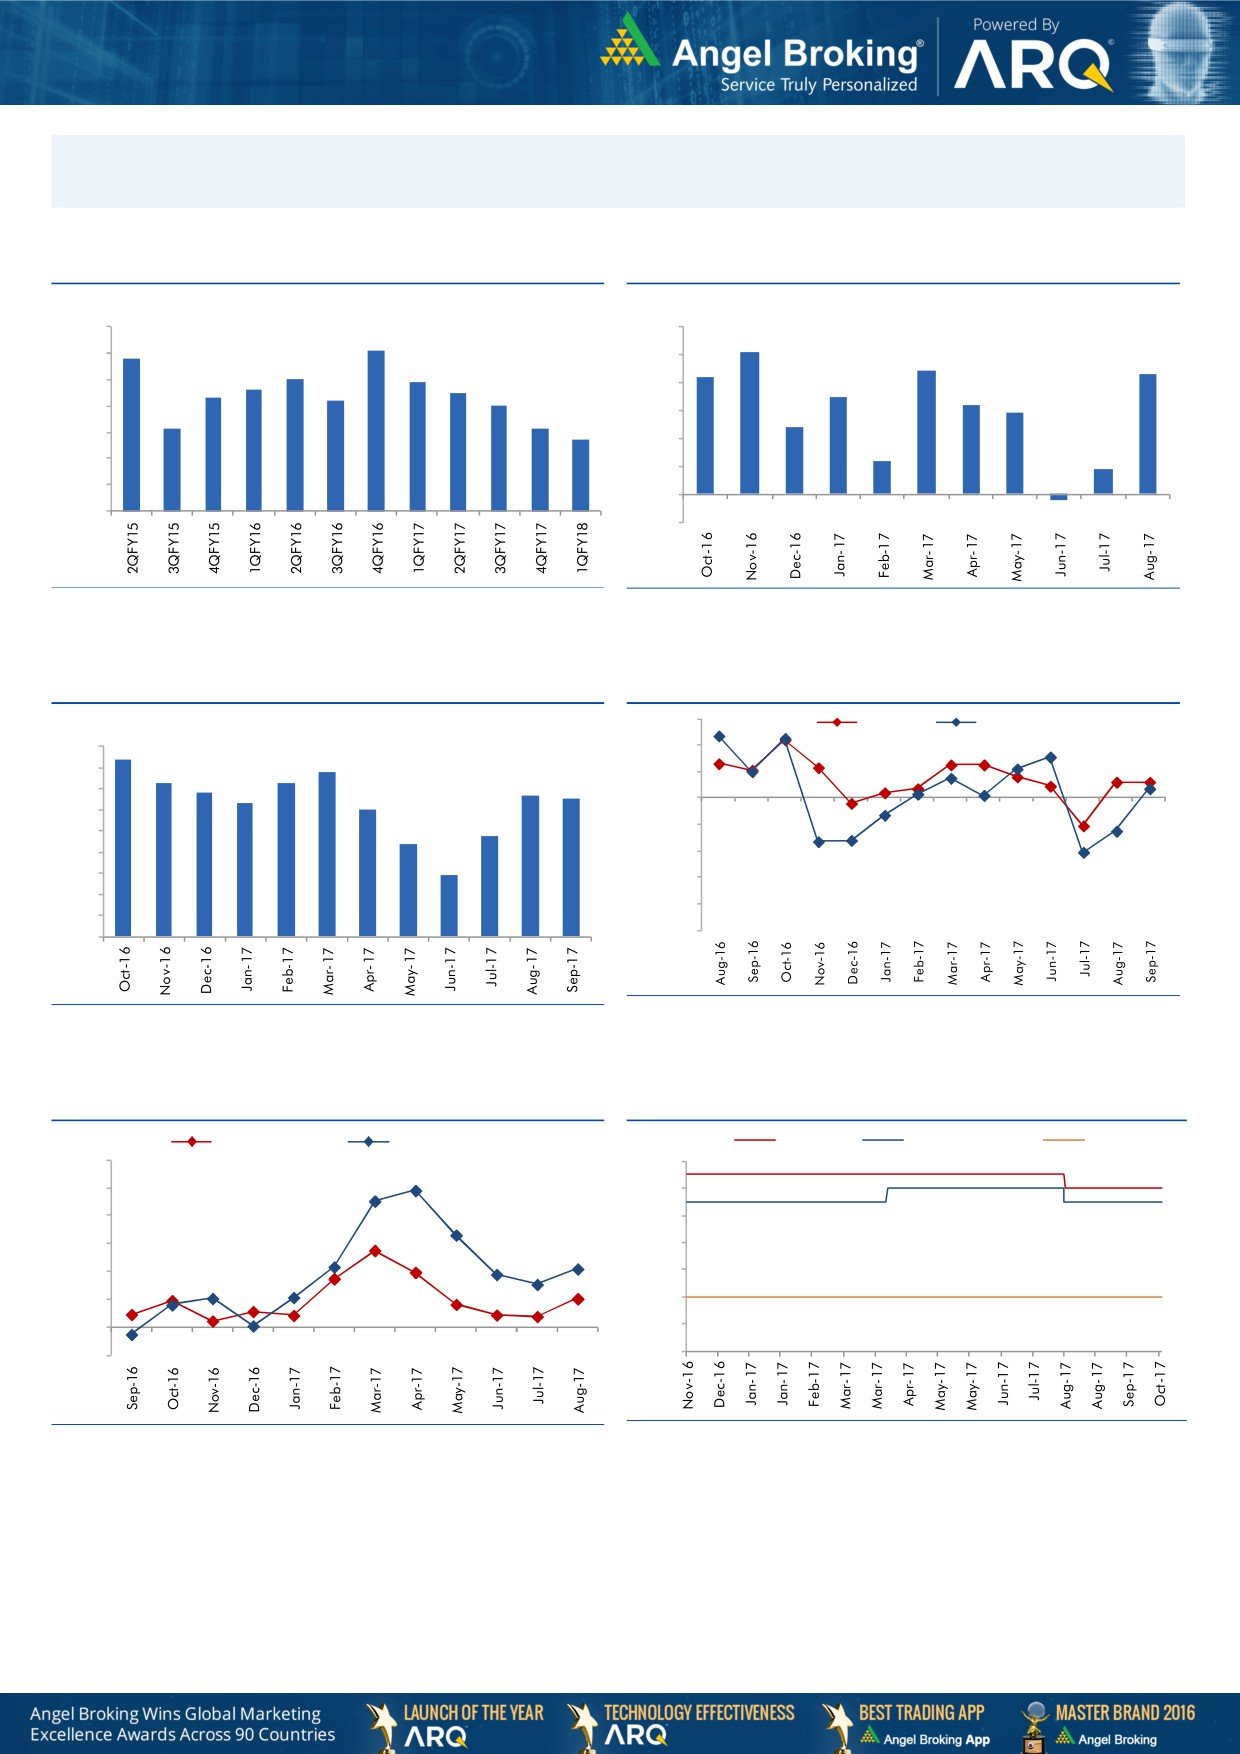
Macro watch
Exhibit 1: Quarterly GDP trends
Exhibit 2: IIP trends
(%)
(%)
10.0
6.0
9.1
5.1
8.8
9.0
5.0
4.4
4.3
8.0
7.9
4.2
7.6
7.5
8.0
7.3
7.2
4.0
3.5
7.0
3.2
2.9
7.0
6.1
6.1
3.0
2.4
5.7
6.0
2.0
1.2
0.9
5.0
1.0
4.0
-
3.0
(1.0)
(0.2)
Source: CSO, Angel Research
Source: MOSPI, Angel Research
Exhibit 3: Monthly CPI inflation trends
Exhibit 4: Manufacturing and services PMI
56.0
Mfg. PMI
Services PMI
(%)
4.5
4.2
54.0
3.9
4.0
3.6
3.7
3.4
3.4
52.0
3.2
3.3
3.5
3.0
50.0
3.0
2.2
2.4
48.0
2.5
2.0
46.0
1.5
1.5
44.0
1.0
42.0
0.5
40.0
-
Source: Market, Angel Research; Note: Level above 50 indicates expansion
Source: MOSPI, Angel Research
Exhibit 5: Exports and imports growth trends
Exhibit 6: Key policy rates
(%)
Exports yoy growth
Imports yoy growth
(%)
Repo rate
Reverse Repo rate
CRR
60.0
6.50
50.0
6.00
40.0
5.50
30.0
5.00
20.0
4.50
10.0
4.00
0.0
3.50
(10.0)
3.00
Source: Bloomberg, Angel Research
Source: RBI, Angel Research
Market Outlook
October 16, 2017
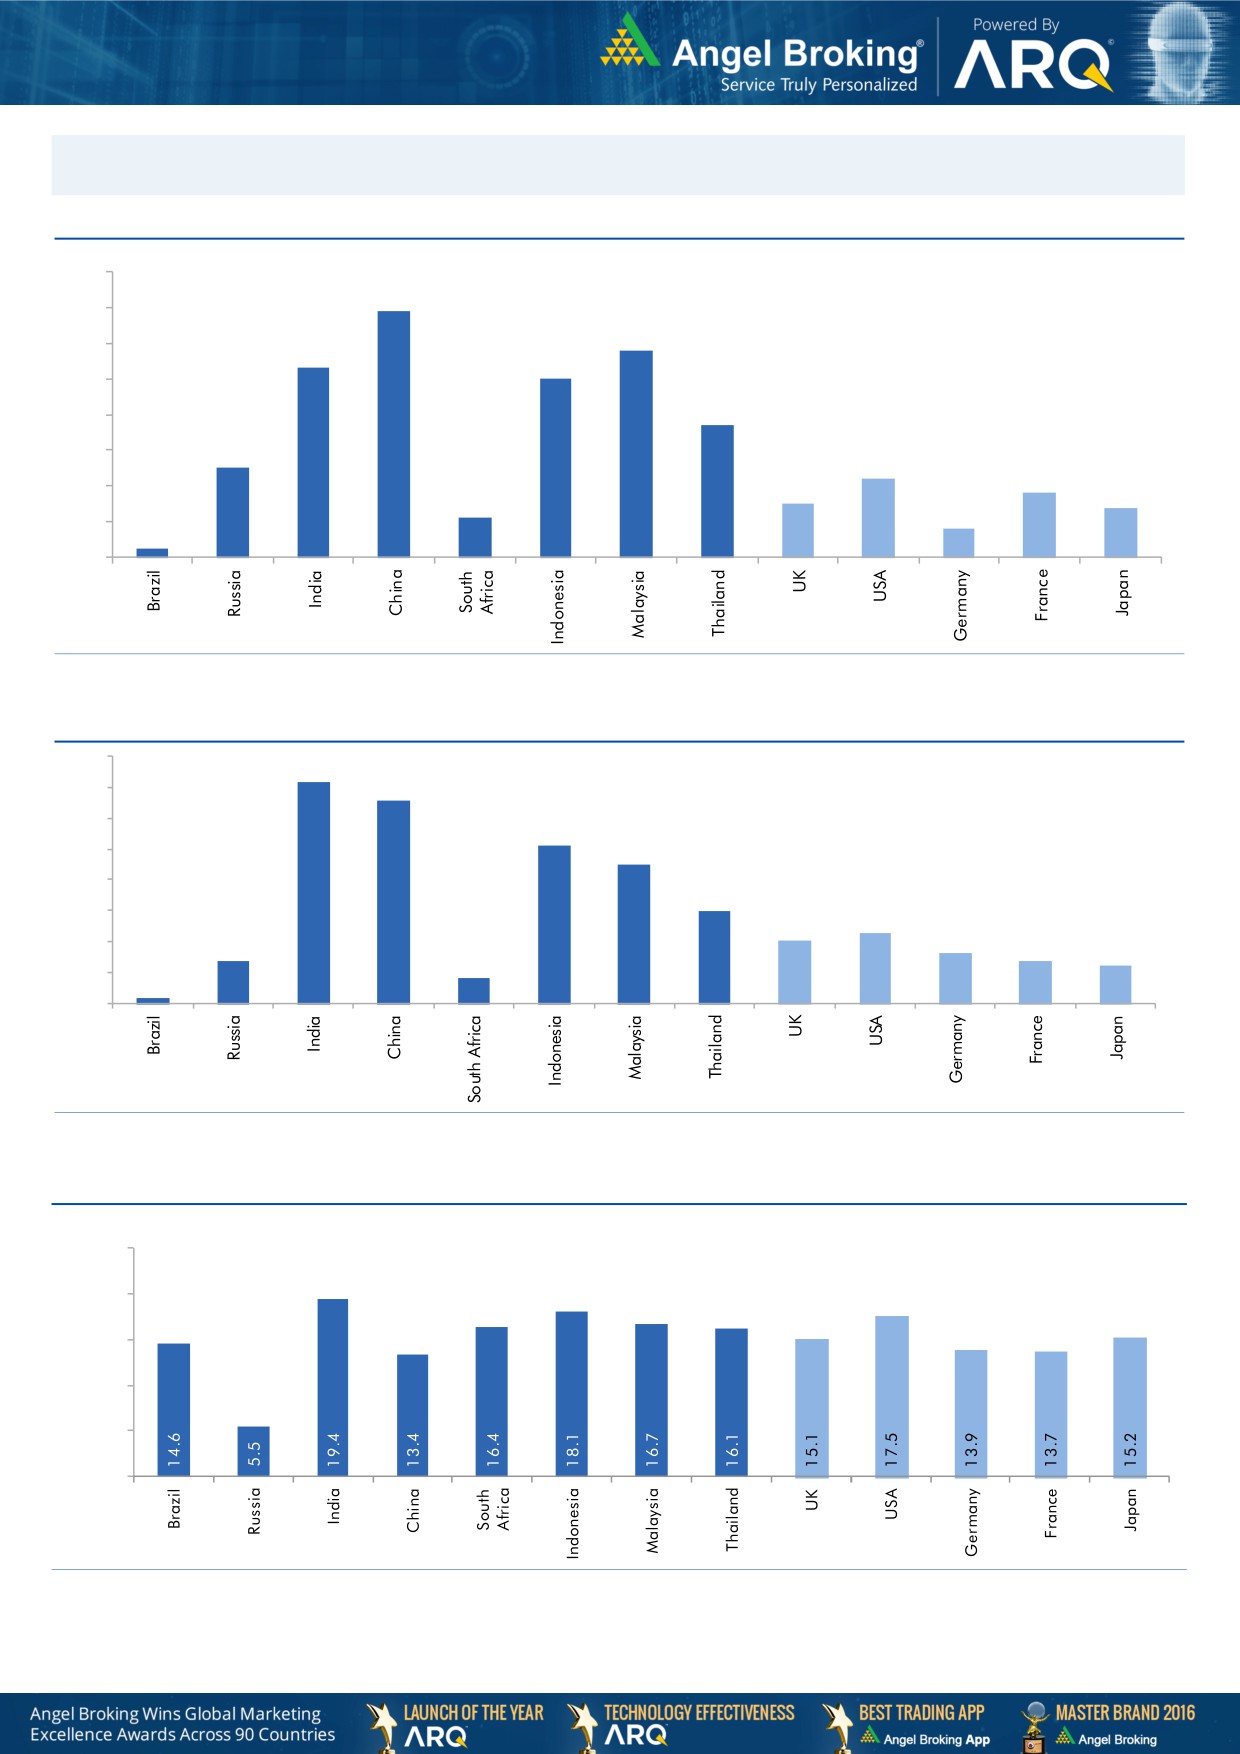
Global watch
Exhibit 1: Latest quarterly GDP Growth (%, yoy) across select developing and developed countries
(%)
8.0
6.9
7.0
5.8
6.0
5.3
5.0
5.0
1.1
3.7
4.0
2.5
3.0
2.2
1.8
2.0
1.5
1.4
0.8
1.0
0.3
-
Source: Bloomberg, Angel Research
Exhibit 2: 2017 GDP Growth projection by IMF (%, yoy) across select developing and developed countries
(%)
7.2
6.6
7.0
6.0
5.1
5.0
4.5
4.0
3.0
3.0
2.3
2.0
1.4
1.6
2.0
1.4
1.2
0.2
0.8
1.0
-
Source: IMF, Angel Research
Exhibit 3: One year forward P-E ratio across select developing and developed countries
(x)
25
20
15
10
5
0
Source: IMF, Angel Research
Market Outlook
October 16, 2017
Exhibit 4: Relative performance of indices across globe
Returns (%)
Country
Name of index
Closing price
1M
3M
1YR
Brazil
Bovespa
76,990
3.3
18.1
24.8
Russia
Micex
2,099
2.2
7.1
7.2
India
Nifty
10,167
0.7
3.6
16.7
China
Shanghai Composite
3,391
0.8
5.9
13.1
South Africa
Top 40
51,450
3.0
9.3
13.3
Mexico
Mexbol
49,982
(0.4)
(2.6)
4.9
Indonesia
LQ45
987
1.7
1.2
5.4
Malaysia
KLCI
1,755
(1.9)
0.0
5.3
Thailand
SET 50
1,094
4.2
9.9
13.6
USA
Dow Jones
22,872
3.2
5.7
26.1
UK
FTSE
7,535
2.1
2.1
8.5
Japan
Nikkei
21,155
8.2
4.8
25.2
Germany
DAX
12,992
3.7
2.9
22.0
France
CAC
5,352
2.6
2.3
18.0
Source: Bloomberg, Angel Research, p68in4
Stock Watch
October 16, 2017
Company Name
Reco
CMP
Target
Mkt Cap
Sales ( Čcr )
OPM(%)
EPS (Č)
PER(x)
P/BV(x)
RoE(%)
EV/Sales(x)
(Č)
Price ( Č)
( Č cr )
FY18E FY19E
FY18E
FY19E
FY18E
FY19E
FY18E
FY19E
FY18E
FY19E
FY18E
FY19E
FY18E
FY19E
Agri / Agri Chemical
Rallis
Reduce
236
209
4,596
1,873
2,099
15.0
15.0
9.5
10.5
24.9
22.5
3.8
3.4
15.8
16.0
2.3
2.1
United Phosphorus
Neutral
803
-
40,785
18,922
21,949
18.0
18.5
36.2
45.6
22.2
17.6
4.6
3.8
22.7
23.8
2.3
1.9
Auto & Auto Ancillary
Ashok Leyland
Neutral
125
-
36,640
23,339
27,240
10.1
10.8
4.7
6.2
26.9
20.1
5.4
4.7
20.0
23.6
1.5
1.3
Bajaj Auto
Neutral
3,165
-
91,576
23,936
27,955
19.5
20.1
142.7
167.3
22.2
18.9
4.8
4.3
21.8
22.8
3.4
2.9
Bharat Forge
Buy
640
875
29,791
7,637
8,755
21.7
23.2
36.1
47.3
17.7
13.5
3.2
2.7
18.5
20.8
3.8
3.2
Eicher Motors
Neutral
31,399
-
85,477
19,043
22,837
19.5
19.9
835.4
1,019.0
37.6
30.8
14.0
10.8
40.9
37.8
4.4
3.6
Gabriel India
Neutral
202
-
2,897
1,782
2,033
9.7
10.2
7.1
8.9
28.4
22.8
5.7
4.9
21.0
22.2
1.6
1.4
Hero Motocorp
Accumulate
3,754
4,129
74,968
32,239
36,878
16.0
15.6
184.4
206.5
20.4
18.2
6.4
5.6
31.3
30.7
2.1
1.8
Jamna Auto Industries Neutral
59
-
2,333
1,441
1,662
14.4
14.8
13.9
17.6
4.2
3.3
1.2
0.9
30.0
31.0
1.6
1.4
Mahindra and Mahindra Neutral
1,326
-
82,382
46,971
53,816
13.6
14.0
67.7
79.8
19.6
16.6
2.8
2.5
15.0
15.9
1.6
1.4
Maruti
Accumulate
7,872
8,658
237,804
81,825
101,245
15.0
15.0
283.5
356.0
27.8
22.1
6.1
4.9
21.9
22.4
2.6
2.0
Minda Industries
Neutral
827
-
7,143
4,328
5,084
11.0
11.9
27.3
36.4
30.3
22.7
6.4
5.0
23.1
25.6
1.7
1.5
Motherson Sumi
Neutral
355
-
74,744
55,937
64,445
10.8
11.4
16.9
21.1
21.0
16.9
4.7
4.8
25.2
25.4
1.4
1.2
Tata Motors
Neutral
424
-
122,553
303,167
343,649
11.8
13.8
33.1
54.7
12.8
7.8
2.1
1.7
16.9
23.0
0.5
0.4
TVS Motor
Neutral
699
-
33,209
13,992
16,216
9.0
9.4
17.1
20.3
41.0
34.4
10.9
8.4
29.7
27.7
2.3
1.9
Amara Raja Batteries
Buy
689
858
11,767
6,140
7,122
14.3
15.6
29.3
39.0
23.5
17.7
4.0
3.4
17.1
19.0
1.9
1.6
Exide Industries
Neutral
205
-
17,429
8,689
9,854
15.1
15.2
9.7
11.0
21.3
18.6
3.8
3.3
15.7
16.1
1.7
1.5
Apollo Tyres
Neutral
242
-
12,308
15,739
17,326
13.3
14.6
20.4
26.7
11.9
9.1
1.4
1.3
20.4
26.7
1.0
0.9
Ceat
Neutral
1,728
-
6,989
6,661
7,717
11.1
14.2
116.2
178.2
14.9
9.7
2.6
2.2
15.2
21.3
1.2
1.0
JK Tyres
Neutral
149
-
3,389
8,318
9,239
16.2
16.4
21.0
27.5
7.1
5.4
1.4
1.1
19.1
20.4
0.9
0.7
Swaraj Engines
Neutral
2,040
-
2,534
788
889
16.4
16.5
71.6
81.0
28.5
25.2
8.2
7.6
29.6
31.0
2.9
2.5
Subros
Neutral
243
-
1,460
1,855
2,135
11.6
11.8
10.3
14.7
23.8
16.6
3.6
3.1
15.8
19.1
1.0
0.9
Capital Goods
BEML
Neutral
1,724
-
7,180
4,286
5,194
7.1
8.2
42.9
58.1
40.2
29.7
3.3
3.0
7.6
8.7
1.7
1.4
Bharat Electronics
Neutral
171
-
42,015
10,258
12,470
19.6
19.5
7.3
8.6
23.4
19.9
0.5
0.4
20.4
21.9
3.6
2.9
Voltas
Neutral
532
-
17,596
6,778
8,004
9.6
11.0
17.1
22.4
31.1
23.7
7.4
6.5
17.7
19.8
2.3
1.9
BHEL
Neutral
84
-
31,005
33,200
39,167
6.8
9.5
6.2
11.2
13.6
7.5
0.6
0.6
4.6
8.0
0.5
0.4
Blue Star
Accumulate
785
867
7,517
5,220
6,207
6.3
6.6
16.8
22.3
46.7
35.2
9.3
8.2
19.9
23.3
1.4
1.2
CG Power and Industrial
Neutral
79
-
4,926
6,555
7,292
7.5
7.5
-
0.8
7,860.0
98.3
1.2
1.2
0.1
1.2
0.8
0.8
Solutions
Greaves Cotton
Neutral
131
-
3,188
1,778
1,993
14.7
15.1
8.1
9.1
16.1
14.4
3.6
3.4
21.8
23.6
1.6
1.4
Stock Watch
October 16, 2017
Company Name
Reco
CMP
Target
Mkt Cap
Sales ( Čcr )
OPM(%)
EPS (Č)
PER(x)
P/BV(x)
RoE(%)
EV/Sales(x)
(Č)
Price ( Č)
( Č cr )
FY18E FY19E
FY18E
FY19E
FY18E
FY19E
FY18E
FY19E
FY18E
FY19E
FY18E
FY19E
FY18E
FY19E
Capital Goods
KEC International
Buy
302
350
7,771
9,779
11,113
9.4
9.8
14.2
18.2
21.3
16.6
4.1
3.3
21.1
22.1
1.1
0.9
KEI Industries
Accumulate
336
380
2,615
3,001
3,391
10.0
10.0
13.0
16.1
25.8
20.9
4.7
3.9
18.2
18.7
1.0
0.9
Thermax
Neutral
929
-
11,070
4,125
4,747
10.3
10.8
26.7
31.5
34.8
29.5
3.9
3.6
11.2
12.0
2.4
2.1
VATech Wabag
Buy
581
681
3,170
3,867
4,126
9.6
10.0
34.9
39.8
16.6
14.6
2.8
2.4
17.7
17.5
0.8
0.8
Cement
ACC
Neutral
1,767
-
33,180
12,255
13,350
13.5
14.3
58.0
66.2
30.5
26.7
3.6
3.4
11.5
12.2
2.7
2.5
Ambuja Cements
Neutral
277
-
55,092
10,250
11,450
17.5
19.0
7.2
8.3
38.5
33.4
2.8
2.6
7.0
7.8
5.2
4.5
India Cements
Neutral
180
-
5,547
6,135
6,750
14.8
15.2
8.5
11.5
21.2
15.7
1.1
1.0
4.8
6.2
1.2
1.1
JK Cement
Neutral
955
-
6,676
4,150
4,775
19.2
20.0
49.0
63.5
19.5
15.0
3.1
2.7
17.0
18.5
2.0
1.7
J K Lakshmi Cement
Neutral
384
-
4,524
3,422
3,757
15.5
17.0
13.5
23.2
28.5
16.6
3.0
2.6
10.8
15.5
1.7
1.5
Orient Cement
Neutral
158
-
3,228
2,215
3,233
16.8
17.0
5.9
6.9
26.7
22.8
2.0
1.9
10.8
10.1
2.5
1.6
UltraTech Cement
Neutral
4,003
-
109,904
28,250
35,150
20.2
23.5
77.5
122.2
51.7
32.8
4.4
3.9
9.6
14.8
4.4
3.5
Construction
KNR Constructions
Neutral
208
-
2,928
1,846
2,203
14.5
14.5
12.1
13.7
17.2
15.3
0.9
0.8
17.5
16.7
1.6
1.4
Larsen & Toubro
Neutral
1,139
-
159,452
95,787
109,476
10.2
11.6
44.5
50.8
25.6
22.4
3.2
2.9
12.9
13.1
2.2
2.0
Gujarat Pipavav Port
Neutral
139
-
6,742
739
842
61.6
62.7
5.1
6.2
27.3
22.7
3.4
3.3
12.7
14.9
8.6
7.4
PNC Infratech
Neutral
147
-
3,778
2,040
2,935
13.0
13.0
6.4
9.0
23.0
16.4
0.6
0.5
9.7
12.2
1.9
1.3
Simplex Infra
Neutral
473
-
2,339
6,012
6,619
11.6
11.7
21.1
31.0
22.5
15.3
1.6
1.4
6.5
8.6
0.9
0.8
Sadbhav Engineering
Accumulate
280
298
4,800
3,823
4,426
10.7
10.8
10.3
11.8
27.2
23.7
3.3
2.9
10.1
10.5
1.6
1.4
NBCC
Neutral
243
-
21,902
9,099
12,706
6.4
6.4
7.3
9.6
33.4
25.4
1.5
1.2
27.5
30.5
2.3
1.6
MEP Infra
Neutral
101
-
1,648
2,403
2,910
18.3
16.8
2.4
6.1
43.1
16.7
16.4
11.0
35.2
55.8
1.8
1.5
SIPL
Neutral
99
-
3,485
2,060
2,390
46.8
47.7
(5.8)
(3.1)
3.7
4.2
(14.2)
(2.3)
6.5
6.0
Engineers India
Neutral
152
-
10,246
1,795
2,611
21.1
22.4
5.9
8.1
25.8
18.8
1.8
1.8
12.9
16.1
4.1
2.6
Financials
Axis Bank
Accumulate
529
580
126,941
32,558
35,843
3.5
3.2
27.8
41.0
19.0
12.9
2.1
1.8
11.4
14.9
-
-
Bank of Baroda
Neutral
140
-
32,166
22,533
26,079
2.4
2.4
12.0
20.9
11.6
6.7
0.8
0.7
6.6
11.0
-
-
Canara Bank
Neutral
308
-
18,408
17,925
20,235
2.0
2.1
18.5
36.5
16.7
8.4
0.6
0.6
3.4
6.2
-
-
Can Fin Homes
Buy
559
2,128
7,437
586
741
3.5
3.5
107.8
141.0
5.2
4.0
1.1
0.9
24.1
25.6
-
-
Cholamandalam Inv. &
Accumulate
1,137
1,230
17,769
2,826
3,307
6.3
6.3
53.7
64.6
21.2
17.6
3.6
3.1
18.3
18.9
-
-
Fin. Co.
Dewan Housing Finance Accumulate
538
610
16,863
2,676
3,383
2.4
2.7
37.4
49.7
14.4
10.8
1.9
1.7
13.8
16.2
-
-
Equitas Holdings
Buy
152
235
5,163
1,125
1,380
9.6
9.8
1.5
6.0
101.6
25.4
2.3
2.2
2.4
8.2
-
-
Federal Bank
Accumulate
117
125
22,840
4,896
5,930
2.8
3.1
5.4
7.6
21.8
15.5
1.9
1.7
8.5
11.0
-
-
Stock Watch
October 16, 2017
Company Name
Reco
CMP
Target
Mkt Cap
Sales ( Čcr )
OPM(%)
EPS (Č)
PER(x)
P/BV(x)
RoE(%)
EV/Sales(x)
(Č)
Price ( Č)
( Č cr )
FY18E FY19E
FY18E
FY19E
FY18E
FY19E
FY18E
FY19E
FY18E
FY19E
FY18E
FY19E
FY18E
FY19E
Financials
GIC Housing
Buy
510
655
2,746
376
477
3.6
3.7
33.0
40.0
15.5
12.8
2.8
2.3
20.0
23.0
-
-
HDFC Bank
Neutral
1,853
-
478,448
55,236
63,253
4.5
4.4
68.9
82.4
26.9
22.5
4.7
3.9
18.7
18.5
-
-
ICICI Bank
Buy
271
315
174,134
42,361
51,378
3.6
3.9
18.4
25.7
14.8
10.6
1.6
1.6
11.3
15.0
-
-
Karur Vysya Bank
Buy
129
180
7,814
3,289
3,630
3.7
3.9
10.8
14.1
11.9
9.2
1.4
1.3
12.5
14.7
-
-
LIC Housing Finance
Neutral
651
-
32,864
4,895
6,332
3.4
3.7
50.7
66.8
12.8
9.8
2.6
2.1
21.7
23.8
-
-
Punjab Natl.Bank
Neutral
135
-
28,738
23,708
25,758
2.1
2.1
5.9
16.4
23.0
8.2
0.7
0.6
3.0
8.3
-
-
RBL Bank
Neutral
518
-
21,380
2,309
2,888
2.6
2.5
16.4
19.1
31.6
27.1
4.0
3.5
13.3
13.8
-
-
Repco Home Finance
Buy
637
825
3,987
496
597
4.4
4.2
38.5
48.7
16.6
13.1
3.0
2.5
19.6
20.6
-
-
South Ind.Bank
Neutral
32
-
5,846
3,195
3,567
3.0
3.1
3.0
3.8
10.7
8.5
1.1
1.0
10.5
11.9
-
-
St Bk of India
Neutral
252
-
217,916
105,827
121,056
2.4
2.5
16.1
25.6
15.7
9.9
1.2
1.1
6.6
9.9
-
-
Union Bank
Neutral
128
-
9,287
14,650
16,225
2.3
2.3
23.1
32.5
5.5
3.9
0.4
0.4
7.1
9.2
-
-
Yes Bank
Neutral
370
-
84,643
11,088
13,138
3.0
2.9
84.0
99.3
4.4
3.7
0.7
0.6
16.3
16.8
-
-
FMCG
Akzo Nobel India
Neutral
1,830
-
8,775
3,164
3,607
13.8
13.7
58.6
67.9
31.2
26.9
7.7
6.8
24.5
25.1
2.6
2.3
Asian Paints
Neutral
1,172
-
112,408
17,603
20,615
18.6
18.6
2,128.9
2,543.3
0.6
0.5
11.6
9.8
28.0
28.9
6.2
5.2
Britannia
Neutral
4,575
-
54,928
9,690
11,278
14.8
15.4
84.0
101.0
54.5
45.3
19.8
15.8
40.6
39.0
5.6
4.8
Colgate
Neutral
1,092
-
29,699
4,420
5,074
24.9
25.3
28.6
32.8
38.2
33.3
15.1
12.2
43.8
40.5
6.5
5.6
Dabur India
Neutral
322
-
56,686
8,346
9,344
19.6
19.9
7.8
9.0
41.3
35.8
8.3
7.5
25.2
24.8
6.4
5.6
GlaxoSmith Con*
Neutral
4,951
-
20,820
5,072
5,760
18.2
18.4
176.3
199.2
28.1
24.9
6.0
5.4
21.2
21.7
3.4
3.0
Godrej Consumer
Neutral
971
-
66,167
10,171
11,682
20.8
21.5
21.7
27.1
44.8
35.8
10.1
8.7
22.3
23.4
6.6
5.7
HUL
Neutral
1,247
-
269,824
37,077
41,508
20.3
21.8
5,189.9
6,318.5
0.2
0.2
38.0
32.5
74.8
82.0
7.1
6.4
ITC
Neutral
266
-
323,814
44,588
49,853
37.0
37.3
9.6
11.0
27.7
24.2
6.8
6.5
25.1
27.3
6.7
6.0
Marico
Neutral
316
-
40,831
6,788
7,766
18.5
19.2
7.1
8.5
44.6
37.2
15.6
13.4
36.9
38.0
5.9
5.1
Nestle*
Neutral
7,341
-
70,775
10,083
11,182
20.0
20.9
119.7
141.3
61.3
52.0
216.1
197.5
36.7
39.8
6.7
6.0
Tata Global
Neutral
210
-
13,270
7,121
7,641
11.9
12.3
6.9
8.0
30.5
26.3
2.0
1.9
6.8
7.2
1.7
1.5
Procter & Gamble
Neutral
8,670
-
28,145
3,034
3,579
27.1
27.7
167.7
198.8
51.7
43.6
13.9
12.0
28.8
29.5
8.7
7.3
Hygiene
IT
HCL Tech^
Accumulate
924
1,014
131,782
52,342
57,053
20.9
20.9
62.8
67.6
14.7
13.7
3.3
2.8
22.4
20.6
2.2
1.9
Infosys
Buy
932
1,179
214,054
73,963
80,619
26.0
26.0
64.4
69.3
14.5
13.5
2.9
2.6
19.7
19.6
2.3
2.1
TCS
Neutral
2,557
-
503,789
127,403
138,870
27.6
27.6
144.5
156.0
17.7
16.4
5.3
4.9
29.7
29.8
3.6
3.3
Tech Mahindra
Accumulate
475
533
46,355
31,015
33,496
15.0
15.0
35.6
38.1
13.3
12.5
2.3
2.1
17.0
16.3
1.3
1.1
Stock Watch
October 16, 2017
Company Name
Reco
CMP
Target
Mkt Cap
Sales ( Čcr )
OPM(%)
EPS (Č)
PER(x)
P/BV(x)
RoE(%)
EV/Sales(x)
(Č)
Price ( Č)
( Č cr )
FY18E FY19E
FY18E
FY19E
FY18E
FY19E
FY18E
FY19E
FY18E
FY19E
FY18E
FY19E
FY18E
FY19E
IT
Wipro
Neutral
292
-
142,034
58,536
61,858
20.3
20.3
18.2
19.1
16.0
15.3
2.5
2.2
14.6
13.4
2.4
2.2
Media
D B Corp
Neutral
371
-
6,819
2,404
2,625
30.5
31.5
23.7
26.9
15.6
13.8
3.7
3.1
23.5
22.8
2.7
2.4
HT Media
Neutral
94
-
2,188
2,589
2,830
15.1
15.4
8.3
10.9
11.3
8.6
0.9
0.8
8.4
10.4
0.4
0.3
Jagran Prakashan
Buy
174
225
5,680
2,541
2,835
28.5
28.7
12.7
14.1
13.7
12.3
2.8
2.5
21.3
21.4
2.1
1.8
Sun TV Network
Neutral
799
-
31,481
3,238
3,789
51.9
55.1
30.9
38.0
25.9
21.0
7.4
6.5
30.0
31.0
9.2
7.8
Hindustan Media
Neutral
250
-
1,835
1,002
1,074
23.3
23.5
29.2
33.8
8.6
7.4
1.3
1.1
15.6
15.4
0.8
0.6
Ventures
TV Today Network
Buy
362
435
2,161
667
727
27.7
27.7
18.6
20.1
19.5
18.1
3.0
3.1
15.6
17.3
2.8
2.6
Music Broadcast Limited Accumulate
395
434
2,255
271
317
91.0
109.0
6.0
10.0
65.9
39.5
4.1
3.7
6.5
9.3
7.9
6.5
Metals & Mining
Coal India
Neutral
288
-
178,804
82,301
91,235
17.0
18.0
17.1
20.5
16.9
14.1
3.2
3.0
45.0
55.0
1.8
1.6
Hind. Zinc
Neutral
320
-
135,379
22,108
24,555
57.0
58.0
22.1
26.3
14.5
12.2
4.7
3.8
32.0
35.0
5.1
4.3
Hindalco
Neutral
266
-
59,714
102,350
105,355
13.5
14.5
21.5
24.5
12.4
10.9
1.7
1.4
15.0
15.2
1.2
1.1
JSW Steel
Neutral
254
-
61,277
64,500
68,245
21.1
21.5
20.1
21.2
12.6
12.0
2.3
2.0
-
-
1.7
1.6
NMDC
Neutral
120
-
38,062
10,209
11,450
47.0
48.0
11.1
12.1
10.8
9.9
1.5
1.4
-
-
3.2
2.9
SAIL
Neutral
58
-
23,851
54,100
63,555
3.0
10.0
(10.0)
1.5
38.5
0.8
0.8
-
-
1.4
1.2
Vedanta
Neutral
321
-
119,471
81,206
87,345
28.0
29.0
26.5
33.5
12.1
9.6
2.8
2.4
-
-
2.2
1.9
Tata Steel
Neutral
711
-
69,015
121,445
126,500
16.2
17.2
65.4
81.3
10.9
8.8
1.7
1.5
-
-
1.1
1.0
Oil & Gas
GAIL
Neutral
437
-
73,868
53,115
52,344
14.2
15.3
30.0
31.1
14.6
14.0
1.8
1.7
-
-
1.1
1.1
ONGC
Neutral
170
-
218,293
83,111
84,934
44.2
44.9
16.4
16.9
10.4
10.1
1.3
1.2
-
-
2.5
2.5
Indian Oil Corp
Neutral
415
-
201,326
396,116
432,560
8.5
8.8
40.1
42.2
10.3
9.8
1.8
1.6
-
-
0.7
0.6
Reliance Industries
Neutral
877
-
570,188
257,711
267,438
17.0
18.2
89.1
89.5
9.8
9.8
0.9
0.9
-
-
1.9
1.8
Pharmaceuticals
Alembic Pharma
Buy
495
600
9,334
3,903
4,584
18.2
19.2
21.8
27.2
22.7
18.2
4.1
3.4
19.8
20.6
2.4
2.1
Alkem Laboratories Ltd
Accumulate
1,831
2,079
21,891
6,320
7,341
17.5
19.8
72.7
96.6
25.2
19.0
4.5
3.8
16.7
18.7
3.4
2.9
Aurobindo Pharma
Accumulate
745
823
43,663
17,086
19,478
22.1
22.0
44.7
51.4
16.7
14.5
3.7
3.0
24.7
22.7
2.7
2.3
Aventis*
Neutral
4,220
-
9,719
2,508
2,862
16.8
16.8
139.9
153.8
30.2
27.4
4.4
3.6
23.5
25.8
3.5
2.9
Cadila Healthcare
Sell
501
426
51,330
11,584
13,228
20.3
20.4
18.7
21.3
26.8
23.5
6.0
4.9
24.6
22.9
4.3
3.7
Cipla
Sell
592
458
47,645
16,619
19,437
15.4
16.2
19.7
24.3
30.1
24.4
3.4
3.0
12.0
13.2
3.0
2.6
Dr Reddy's
Neutral
2,352
-
38,993
15,844
17,973
17.6
18.2
91.7
111.0
25.7
21.2
2.9
2.6
11.9
13.0
2.7
2.4
GSK Pharma*
Neutral
2,453
-
20,774
3,260
3,651
15.0
18.0
46.1
58.6
53.2
41.9
10.9
11.3
20.0
26.5
6.3
5.7
Indoco Remedies
Sell
246
153
2,266
1,154
1,310
14.9
14.9
11.3
12.7
21.8
19.4
3.1
2.7
15.0
15.0
2.1
1.8
Stock Watch
October 16, 2017
Company Name
Reco
CMP
Target
Mkt Cap
Sales ( Čcr )
OPM(%)
EPS (Č)
PER(x)
P/BV(x)
RoE(%)
EV/Sales(x)
(Č)
Price ( Č)
( Č cr )
FY18E FY19E
FY18E
FY19E
FY18E
FY19E
FY18E
FY19E
FY18E
FY19E
FY18E
FY19E
FY18E
FY19E
Pharmaceuticals
Ipca labs
Accumulate
500
540
6,314
3,593
4,022
14.5
15.5
19.4
25.2
25.8
19.9
2.4
2.1
9.5
11.2
1.8
1.6
Lupin
Buy
1,061
1,467
47,954
18,657
21,289
21.3
23.3
52.8
66.7
20.1
15.9
3.0
2.6
16.3
17.5
2.6
2.2
Natco Pharma
Accumulate
990
1,057
17,250
1,886
2,016
32.3
29.5
23.2
22.0
42.8
44.9
8.9
7.9
20.9
17.6
9.0
8.4
Sun Pharma
Neutral
535
-
128,288
32,899
36,451
26.9
25.4
31.6
32.3
16.9
16.6
3.0
2.6
18.7
18.8
3.5
3.0
Syngene International
Accumulate
493
557
9,857
1,402
1,823
32.8
36.0
15.9
20.7
31.1
23.9
5.8
4.8
18.7
20.0
7.0
5.4
Power
Tata Power
Neutral
82
-
22,084
32,547
33,806
20.5
20.5
4.7
5.4
17.4
15.3
1.7
1.4
10.5
10.5
1.7
1.6
NTPC
Neutral
176
-
145,079
86,070
101,246
28.3
30.7
12.9
16.2
13.6
10.9
1.4
1.3
10.6
12.4
3.0
2.7
Power Grid
Accumulate
206
223
107,535
29,183
32,946
89.7
90.0
18.0
20.8
11.5
9.9
1.9
1.7
17.7
18.2
7.6
7.1
Real Estate
Prestige Estate
Neutral
286
-
10,712
4,607
5,146
21.0
22.2
7.9
9.8
36.2
29.2
2.2
2.1
10.3
12.0
3.5
3.2
MLIFE
Accumulate
461
522
2,366
487
590
12.3
17.8
21.0
31.2
22.0
14.8
1.2
1.1
5.2
7.4
3.6
2.9
Telecom
Bharti Airtel
Neutral
432
-
172,528
97,903
105,233
36.0
36.3
9.3
11.1
46.4
39.1
2.2
2.1
5.0
5.6
2.7
2.5
Idea Cellular
Neutral
79
-
28,458
35,012
37,689
27.1
27.7
(4.4)
(2.7)
1.2
1.3
(6.8)
(4.6)
2.1
1.9
zOthers
Abbott India
Neutral
4,235
-
8,998
3,244
3,723
14.9
16.1
167.5
209.4
25.3
20.2
5.6
4.7
23.7
24.8
2.4
2.0
Asian Granito
Buy
487
570
1,466
1,169
1,286
12.5
12.5
16.0
19.7
30.5
24.7
3.3
2.9
10.7
11.6
1.5
1.3
Bajaj Electricals
Neutral
392
-
3,982
4,646
5,301
6.7
7.6
16.1
22.3
24.4
17.6
4.0
3.4
16.4
19.2
0.9
0.8
Banco Products (India)
Neutral
220
-
1,571
1,530
1,695
13.2
12.7
19.0
20.0
11.6
11.0
1.9
1.6
0.2
0.2
0.9
104.1
Coffee Day Enterprises
Neutral
220
-
4,539
3,494
3,913
17.4
18.0
4.8
5.7
-
38.7
2.0
1.9
-
0.1
1.8
1.5
Ltd
Elecon Engineering
Neutral
67
-
756
171
201
15.0
16.2
36.0
43.0
1.9
1.6
0.2
0.1
0.1
0.1
3.8
3.2
Garware Wall Ropes
Neutral
909
-
1,990
928
1,003
15.2
15.2
39.4
43.2
23.1
21.1
3.8
3.3
16.5
15.4
2.0
1.8
Goodyear India*
Neutral
815
-
1,879
1,717
1,866
11.8
12.3
47.9
49.8
17.0
16.4
2.6
2.3
15.6
15.7
0.8
113.1
Hitachi
Neutral
2,026
-
5,510
2,355
2,715
10.3
10.8
49.0
60.9
41.4
33.3
9.7
7.7
0.2
0.2
2.4
2.0
HSIL
Neutral
441
-
3,191
2,240
2,670
14.6
15.0
17.0
22.0
26.0
20.1
2.1
2.0
0.1
0.1
1.6
1.3
Interglobe Aviation
Neutral
1,128
-
40,800
22,570
27,955
14.2
15.0
63.6
81.8
17.8
13.8
9.3
7.9
0.5
0.6
1.5
1.1
Jyothy Laboratories
Neutral
387
-
7,037
1,781
2,044
14.1
15.0
9.4
10.5
41.4
36.9
8.8
8.3
0.2
0.2
4.2
3.6
Linc Pen & Plastics
Neutral
251
-
372
420
462
9.3
9.3
15.3
17.1
16.4
14.7
2.8
2.9
16.9
19.5
0.9
0.9
M M Forgings
Neutral
839
-
1,013
542
642
20.1
21.0
41.6
56.8
20.2
14.8
2.8
2.4
0.1
0.2
2.3
2.0
Mirza International
Neutral
162
-
1,952
1,148
1,285
18.0
18.0
8.0
9.4
20.2
17.4
3.3
2.8
16.3
16.1
1.9
1.6
Navkar Corporation
Buy
192
265
2,735
561
617
41.5
41.5
11.5
12.7
16.7
15.1
1.8
1.6
10.5
10.4
5.5
4.8
Nilkamal
Neutral
1,635
-
2,439
2,317
2,525
11.4
11.1
96.0
105.0
17.0
15.6
2.9
2.5
0.2
0.2
1.0
0.9
Stock Watch
October 16, 2017
Company Name
Reco
CMP
Target Mkt Cap
Sales ( Čcr )
OPM(%)
EPS (Č)
PER(x)
P/BV(x)
RoE(%)
EV/Sales(x)
(Č)
Price ( Č)
( Č cr )
FY18E FY19E FY18E FY19E FY18E FY19E FY18E FY19E FY18E FY19E FY18E FY19E FY18E FY19E
zOthers
Parag Milk Foods
Neutral
263
-
2,211
1,987
2,379
7.6
9.0
12.4
18.3
21.2
14.4
3.0
2.6
8.2
13.2
1.2
1.0
Radico Khaitan
Neutral
187
-
2,485
1,811
1,992
13.2
13.2
8.1
8.8
23.0
21.2
2.3
2.5
10.1
12.0
1.7
1.5
Relaxo Footwears
Neutral
515
-
6,185
1,981
2,310
13.7
14.5
12.0
15.5
42.9
33.2
8.4
6.8
0.2
0.2
3.2
2.7
Siyaram Silk Mills
Accumulate
2,683
2,856
2,515
1,769
1,981
12.7
12.7
113.1
131.1
23.7
20.5
3.7
3.2
15.5
15.5
1.6
1.4
Styrolution ABS India* Neutral
1,042
-
1,833
1,800
1,980
8.0
8.1
42.0
46.2
24.8
22.6
2.8
2.5
0.1
0.1
1.1
1.0
Surya Roshni
Neutral
308
-
1,352
4,870
5,320
7.7
7.8
22.8
28.1
13.6
11.0
1.8
1.6
0.1
0.1
0.5
0.4
TVS Srichakra
Neutral
3,100
-
2,374
2,729
2,893
12.7
12.5
248.5
265.0
12.5
11.7
3.5
2.9
0.3
0.3
0.9
0.8
Visaka Industries
Neutral
691
-
1,097
1,104
1,214
12.1
12.6
31.0
37.9
22.3
18.3
2.7
2.4
0.1
0.1
1.2
1.1
VIP Industries
Accumulate
265
300
3,748
1,450
1,693
10.4
10.5
6.5
7.8
40.5
34.0
8.6
7.5
21.1
22.1
2.6
2.2
Navin Fluorine
Neutral
718
-
3,541
945
1,154
22.4
22.6
28.7
34.8
25.0
20.7
4.1
3.5
-
-
3.3
2.6
Source: Company, Angel Research; Note: *December year end; #September year end; &October year end; Price as on October 13, 2017
Market Outlook
October 16, 2017
Research Team Tel: 022 - 39357800
DISCLAIMER
Angel Broking Private Limited (hereinafter referred to as “Angel”) is a registered Member of National Stock Exchange of India
Limited,Bombay Stock Exchange Limited and Metropolitan Stock Exchange Limited. It is also registered as a Depository Participant with
CDSL and Portfolio Manager with SEBI. It also has registration with AMFI as a Mutual Fund Distributor. Angel Broking Private Limited is a
registered entity with SEBI for Research Analyst in terms of SEBI (Research Analyst) Regulations, 2014 vide registration number
INH000000164. Angel or its associates has not been debarred/ suspended by SEBI or any other regulatory authority for accessing
/dealing in securities Market. Angel or its associates/analyst has not received any compensation / managed or
co-managed public offering of securities of the company covered by Analyst during the past twelve months.
This document is solely for the personal information of the recipient, and must not be singularly used as the basis of any investment
decision. Nothing in this document should be construed as investment or financial advice. Each recipient of this document should make
such investigations as they deem necessary to arrive at an independent evaluation of an investment in the securities of the companies
referred to in this document (including the merits and risks involved), and should consult their own advisors to determine the merits and
risks of such an investment.
Reports based on technical and derivative analysis center on studying charts of a stock's price movement, outstanding positions and
trading volume, as opposed to focusing on a company's fundamentals and, as such, may not match with a report on a company's
fundamentals. Investors are advised to refer the Fundamental and Technical Research Reports available on our website to evaluate the
contrary view, if any.
The information in this document has been printed on the basis of publicly available information, internal data and other reliable
sources believed to be true, but we do not represent that it is accurate or complete and it should not be relied on as such, as this
document is for general guidance only. Angel Broking Pvt. Limited or any of its affiliates/ group companies shall not be in any way
responsible for any loss or damage that may arise to any person from any inadvertent error in the information contained in this report.
Angel Broking Pvt. Limited has not independently verified all the information contained within this document. Accordingly, we cannot
testify, nor make any representation or warranty, express or implied, to the accuracy, contents or data contained within this document.
While Angel Broking Pvt. Limited endeavors to update on a reasonable basis the information discussed in this material, there may be
regulatory, compliance, or other reasons that prevent us from doing so.
This document is being supplied to you solely for your information, and its contents, information or data may not be reproduced,
redistributed or passed on, directly or indirectly.
Neither Angel Broking Pvt. Limited, nor its directors, employees or affiliates shall be liable for any loss or damage that may arise from
or in connection with the use of this information.